Observing different samples and using a microscope to analyze the porous ceramic filter defect and slag inclusion analysis will directly help the subsequent improvement of the process.
1 Sample processing
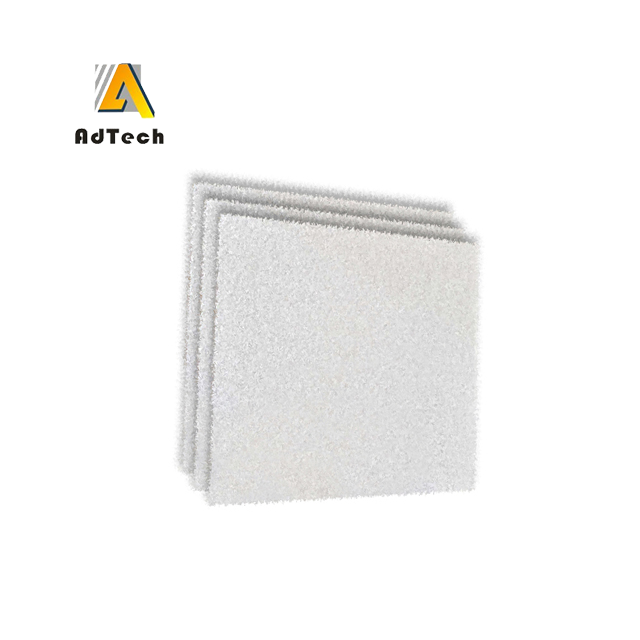
Take the poured 432×432×50mm 50ppi porous ceramic filter defect and cut the porous ceramic filter defect into pieces as shown cut
After that, the test block is cut along the horizontal direction. The cutting method is shown in Figure 2.
The samples with the label of 3 vertical sections were selected for analysis, and after horizontal cutting, they were numbered from top to bottom, and the numbers were S31, S32, and S33, respectively.
The cut filters are treated, polished, ultrasonically cleaned (cleaned in absolute ethanol), and then irradiated with a Leica DM2700 M light
The processed samples were photographed and analyzed by a metallographic microscope, and the defect distribution of the upper, middle, and lower sections was analyzed. At the same time using KEYENCE VHX-5000
Defects are observed with a super-depth-of-field microscope. Electron microscopy and energy analysis of each sample were performed using a German Zeiss EVO18 field emission scanning electron microscope.
Spectral analysis observation.
2 Results and Analysis
2.1 Microstructure analysis

Figure 3, Figure 5, and Figure 7 are the samples of S31, S32, and S33 magnified 50 times under an optical metallographic microscope, respectively. The white part in the figure is
The metal matrix, the black-striped part is the ceramic network of the porous ceramic filter defect Small rounds, strips, or irregularities can be seen in the metal substrate
grid of slag (or slag holes).
Using the German EVO18 scanning electron microscope Zeiss field emission scanning
Scanning electron microscope for electron microscopy and energy spectrum analysis of each sample
Analysis, it can be seen from the electron microscope pictures that the porous ceramic filter defect and the
In the order of S31, S32, and S33 of the metal matrix, the slag pores
The number of slags is gradually reduced, the slag pores of S33 are significantly reduced, and the gold
The microstructure is denser.
Slag inclusions (slag-containing holes) under the optical metallographic microscope from Table 1
It can be seen from the comparison of the number, size, and the average area of
In terms of the average area of slag inclusion in the field, the upper S31 of the filter plate is similar to the middle S32, and the S33 close to the filter plate is significantly reduced.
The slag captured by the filter plate can be as small as 11 microns.
2.2 Composition analysis of slag inclusions
To make it easier to observe the slag, S32 was taken for observation under a super-depth of field microscope, and a scanning electron microscope was used to analyze the defects by energy spectrum.
